If I am told that the total value of an economy is US$14Trillion I am suitably impressed.
–


–
If you now tell me that consumption makes up 70% of this country’s economy…
https://www.cia.gov/library/publications/the-world-factbook/geos/us.html
(see GDP composition by sector)
… and I am told that consumers had till very recently no savings:
–

–
… the inescapable conclusion is that this country’s GDP is sustained by debt:
–

–
That looks about right I say.
That being the case, I can only conclude the following. Other than for financial services, the very nature of “service” is such that once it is consumed there is no residual value. Thus an economy that is composed of well over 70% of services begs the question of how much real wealth is generated by the service sector. In other words, how much residual value is this economy generating? And in the event that profits generated by the financial services sector should be put towards the purchase of a car or towards a luxury cruise or a holiday in Sharm el Sheikh or a pair of shoes, how much residual value is there left from these purchases that can be sold onwards for more money than the original purchase price?
Answering this question would help us understand the real condition of the wealth structure of society.
But lets not get too technical here.
If I were an economist, the above information tells me (or should tell me) that this situation is tenable for as long as society has stable or increasing disposable income. Because in the event disposable income should be declining, than we would reach a point where in the absence of savings society’s ability to assume more debts is impaired. And if debt can no longer be expanded, then GDP progression would be compromised too… right… ???
–
//
Graph Type: Line Bar Pie Scatter
Recession Bars: On Off
Log Scale: Left Right
Size:

(H) Preserve Ratio
Quick Size: Medium Large X-Large
Image Background Color
Graph Background Color
Text Color
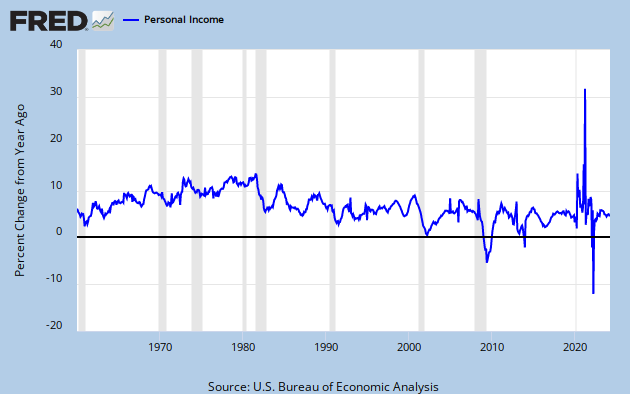
Personal Income, Monthly, Billions of Dollars, Seasonally Adjusted Annual Rate
Units:
Billions of Dollars Change, Billions of Dollars Change from Year Ago, Billions of Dollars Percent Change Percent Change from Year Ago Compounded Annual Rate of Change Continuously Compounded Rate of Change Continuously Compounded Annual Rate of Change Index (Scale value to 100 for chosen period)
Select a US Recession Peak
2007-12-012001-03-011990-07-011981-07-011980-01-011973-11-011969-12-011960-04-01
or Trough
2001-11-011991-03-011982-11-011980-07-011975-03-011970-11-011961-02-01
Or Enter an Obs Date
Display integer periods instead of dates (e.g. …,-1,0,1,…) with the value scaled to 100 at period 0.
Integer Period Range: to
Copied Integer Periods
Min, Max, and Avg Series:
Do not include this series in (min, max, avg) calculations.
Include this series in (min, max, avg) calculations.
Include this series in (min, max, avg) calculations, but do not display this series.
Scale:
Left Right
Line Style:
Solid Dashed Dotted
Mark Type:
None Circle Diamond Square Triangle Up Triangle Down
Color:
Obs Date Range:
to
Copied dates
Obs Quick Range: Custom 5yrs 10yrs Max
Enter an as-of Date:
Or Select a Vintage:
2009-10-012009-08-282009-08-202009-08-042009-06-262009-06-012009-04-302009-03-272009-03-022009-02-022008-12-242008-11-262008-10-312008-09-292008-08-292008-08-042008-06-272008-05-302008-05-012008-03-282008-02-292008-01-312007-12-212007-11-302007-11-012007-09-282007-08-312007-07-312007-06-292007-06-012007-04-302007-03-302007-03-012007-02-012006-12-222006-11-302006-10-302006-09-292006-08-312006-08-012006-06-302006-05-262006-05-042006-05-012006-03-312006-03-012006-01-302005-12-222005-12-012005-10-312005-09-302005-09-012005-08-022005-06-302005-05-272005-04-292005-03-312005-02-282005-01-312004-12-232004-12-012004-11-012004-09-302004-08-302004-08-032004-06-282004-05-282004-04-302004-03-262004-03-012004-02-022004-01-202003-12-312003-12-232003-11-262003-10-312003-09-292003-08-292003-08-012003-06-272003-05-302003-04-282003-03-282003-03-032003-01-312002-12-232002-11-272002-11-012002-09-302002-08-302002-08-022002-06-282002-05-282002-04-292002-03-292002-03-012002-01-312001-12-212001-12-032001-11-012001-10-012001-08-302001-07-312001-07-022001-05-292001-04-302001-03-302001-03-012001-02-012000-12-222000-11-302000-10-302000-09-292000-08-282000-08-012000-06-302000-05-262000-04-282000-03-312000-02-282000-01-311999-12-231999-11-261999-11-021999-10-011999-08-271999-07-301999-06-281999-05-281999-05-031999-04-011999-03-011999-02-011998-12-241998-11-251998-11-021998-09-251998-08-281998-08-031998-06-261998-05-291998-05-011998-03-271998-03-021998-02-021997-12-241997-11-281997-11-031997-09-291997-08-291997-08-011997-06-301997-06-021997-05-071997-05-011997-03-311997-03-031997-02-031996-12-231996-11-291996-10-311996-09-301996-08-301996-08-021996-07-011996-05-311996-05-031996-04-031996-03-041996-01-231995-10-301995-10-021995-08-311995-07-311995-07-031995-06-011995-05-011995-04-031995-03-021995-01-301994-12-231994-12-011994-10-311994-09-301994-08-291994-08-011994-06-301994-05-311994-04-291994-04-011994-03-021994-01-311993-12-231993-12-021993-10-291993-09-301993-08-311993-07-301993-06-241993-06-011993-04-301993-03-291993-03-011993-01-291992-12-231992-11-271992-10-281992-09-251992-08-281992-07-311992-06-261992-06-011992-04-291992-03-271992-03-021992-01-301991-12-231991-11-271991-10-301991-09-271991-08-291991-07-291991-06-271991-05-301991-04-291991-03-281991-02-281991-01-281990-12-201990-11-291990-10-311990-09-261990-08-271990-07-301990-06-221990-05-251990-04-301990-03-291990-03-011990-01-291989-12-211989-11-301989-10-271989-09-221989-08-301989-07-281989-06-231989-05-261989-04-271989-03-241989-03-011989-01-301988-12-211988-11-301988-10-271988-09-211988-08-261988-07-281988-06-241988-05-271988-04-271988-03-241988-02-261988-01-281987-12-181987-11-251987-10-261987-09-211987-08-241987-07-271987-06-181987-05-261987-04-241987-03-191987-02-201987-01-231986-12-181986-11-201986-10-231986-09-191986-08-201986-07-231986-06-191986-05-211986-04-181986-03-201986-02-211986-01-231985-12-231985-11-211985-10-181985-09-191985-08-191985-07-171985-06-191985-05-201985-04-171985-03-201985-02-201985-01-181984-12-181984-11-191984-10-181984-09-191984-08-171984-07-201984-06-191984-05-171984-04-181984-03-191984-02-161984-01-191983-12-201983-11-211983-10-191983-09-201983-08-181983-07-201983-06-201983-05-181983-04-191983-03-181983-02-181983-01-181982-12-201982-11-181982-10-191982-09-201982-08-181982-07-201982-06-181982-05-181982-04-201982-03-181982-02-191982-01-191981-12-171981-11-181981-10-201981-09-171981-08-181981-07-211981-06-171981-05-191981-04-171981-03-171981-02-181981-01-191980-12-221980-11-181980-10-161980-09-181980-08-181980-07-171980-06-171980-05-191980-04-171980-03-181980-02-191980-01-171979-12-181979-11-191979-10-171979-09-181979-08-161979-07-191979-06-191979-05-171979-04-181979-03-191979-02-161979-01-171978-12-181978-11-171978-10-181978-09-181978-08-171978-07-191978-06-161978-05-171978-04-181978-03-171978-02-171978-01-181977-12-161977-11-161977-10-181977-09-161977-08-171977-07-201977-06-171977-05-181977-04-191977-03-171977-02-171977-01-171976-12-161976-11-171976-10-151976-09-161976-08-181976-07-201976-06-161976-05-191976-04-151976-03-171976-02-181976-01-191975-12-171975-11-191975-10-201975-09-171975-08-201975-07-161975-06-181975-05-151975-04-161975-03-191975-02-191975-01-151974-12-181974-11-141974-10-161974-09-181974-08-211974-07-171974-06-201974-05-161974-04-171974-03-201974-02-191974-01-161973-12-181973-11-161973-10-171973-09-191973-08-151973-07-181973-06-201973-05-151973-04-181973-03-191973-02-201973-01-181972-12-201972-11-201972-10-171972-09-151972-08-161972-07-201972-06-141972-05-161972-04-191972-03-171972-02-151972-01-201971-12-171971-11-181971-10-211971-09-161971-08-191971-07-161971-06-161971-05-121971-04-151971-03-171971-02-121971-01-151970-12-171970-11-131970-10-141970-09-171970-08-131970-07-171970-06-171970-05-141970-04-161970-03-181970-02-131970-01-161969-12-181969-11-131969-10-151969-09-181969-08-141969-07-181969-06-181969-05-161969-04-161969-03-181969-02-181969-01-151968-12-171968-11-181968-10-181968-09-171968-08-141968-07-191968-06-171968-05-161968-04-181968-03-151968-02-151968-01-191967-12-181967-11-191967-10-171967-09-181967-08-151967-07-201967-06-151967-05-181967-04-171967-03-201967-02-161967-01-181966-12-111966-11-161966-10-171966-09-161966-08-161966-07-211966-06-151966-05-171966-04-151966-03-161966-02-171966-01-18
Units:
Select a US Recession Peak or Trough
Or Enter an Obs Date
Display integer periods instead of dates (e.g. …,-1,0,1,…) with the value scaled to 100 at period 0.
Integer Period Range: to
Copied Integer Periods
Min, Max, and Avg Series:
Do not include this series in (min, max, avg) calculations.
Include this series in (min, max, avg) calculations.
Include this series in (min, max, avg) calculations, but do not display this series.
Scale:
Line Style:
Solid Dashed Dotted
Mark Type:
None Circle Diamond Square Triangle Up Triangle Down
Color:
Obs Date Range:
to
Copied dates
Enter an as-of Date: Or Select a Vintage:
 Loading …
–
Oh dear! I say! That’s a bit of an unexpected development what! (for best results, say that in you best Oxonian accent)
Looks to me like disposable income has been declining on a relative basis for well over 30 years.
But if the ability of society to assume debt has been steadily declining, then it follows that GDP should have been declining too. But that was clearly not the case. So, it would look to me like something or someone must have stepped-in to make up the difference…
–

–
… there it is … government has more than picked up the slack particularly in the past few months…
–
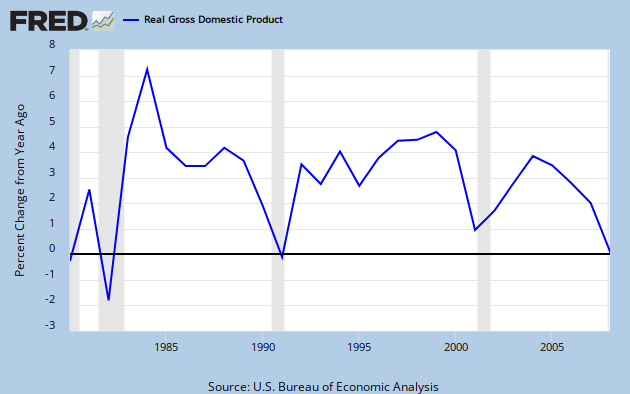
As an economist, I can look at this data and I could draw some conclusions. One of the conclusions I would have to draw inevitably is that for the best part of 30 years there has been no shortage of credit creation thus spending. I mean, credit creation has been on the up and up and has not abated in 30 years… never…
And yet, for all the fuss and circuses, GDP progression only really stumbled along at a rate in the low single digits.
–
//
Graph Type: Line Bar Pie Scatter
Recession Bars: On Off
Log Scale: Left Right
Size:
(H) Preserve Ratio
Quick Size: Medium Large X-Large
Image Background Color
Graph Background Color
Text Color
Real Gross Domestic Product, Annual, Billions of Chained 2005 Dollars
Units:
Billions of Chained 2005 Dollars Change, Billions of Chained 2005 Dollars Change from Year Ago, Billions of Chained 2005 Dollars Percent Change Percent Change from Year Ago Compounded Annual Rate of Change Continuously Compounded Rate of Change Continuously Compounded Annual Rate of Change Index (Scale value to 100 for chosen period)
Select a US Recession Peak
2007-12-012001-03-011990-07-011981-07-011980-01-011973-11-011969-12-011960-04-011957-08-011953-07-011948-11-011945-02-011937-05-011929-08-01
or Trough
2001-11-011991-03-011982-11-011980-07-011975-03-011970-11-011961-02-011958-04-011954-05-011949-10-011945-10-011938-06-011933-03-01
Or Enter an Obs Date
Display integer periods instead of dates (e.g. …,-1,0,1,…) with the value scaled to 100 at period 0.
Integer Period Range: to
Copied Integer Periods
Min, Max, and Avg Series:
Do not include this series in (min, max, avg) calculations.
Include this series in (min, max, avg) calculations.
Include this series in (min, max, avg) calculations, but do not display this series.
Scale:
Left Right
Line Style:
Solid Dashed Dotted
Mark Type:
None Circle Diamond Square Triangle Up Triangle Down
Color:
Obs Date Range:
to
Copied dates
Obs Quick Range: Custom 5yrs 10yrs Max
Enter an as-of Date:
Or Select a Vintage:
2009-07-312009-03-262009-02-272009-01-302008-07-312008-03-272008-02-282008-01-302007-07-272007-03-292007-02-282007-01-312006-07-282006-03-302006-02-282006-01-272005-07-292005-03-302005-02-252005-01-282004-07-302004-03-252004-02-272004-01-302003-12-102003-03-272003-02-282003-01-302002-07-312002-03-282002-02-282002-01-302001-07-272001-03-292001-02-282001-01-312000-07-282000-03-302000-02-252000-01-281999-10-291999-03-311999-02-261999-01-291998-07-311998-03-261998-02-271998-01-301997-07-311997-04-301997-03-281997-02-281997-01-311996-08-011996-04-021996-02-231996-01-191995-03-311995-03-011995-01-271994-07-291994-03-311994-03-011994-01-281993-08-311993-03-261993-02-261993-01-281992-12-221992-09-241992-07-301992-04-281992-03-261992-02-281992-01-291991-12-04
Units:
Select a US Recession Peak or Trough
Or Enter an Obs Date
Display integer periods instead of dates (e.g. …,-1,0,1,…) with the value scaled to 100 at period 0.
Integer Period Range: to
Copied Integer Periods
Min, Max, and Avg Series:
Do not include this series in (min, max, avg) calculations.
Include this series in (min, max, avg) calculations.
Include this series in (min, max, avg) calculations, but do not display this series.
Scale:
Line Style:
Solid Dashed Dotted
Mark Type:
None Circle Diamond Square Triangle Up Triangle Down
Color:
Obs Date Range:
to
Copied dates
Enter an as-of Date: Or Select a Vintage:
Loading …
–
Now as I show you here, other than for a time lag there is absolutely no difference between government debt and the debt of individuals and corporations. Thus if we have reached the point we have reached today, what on God’s green earth can make an economist think that even more spending can make things right or even just improve anything?
Can anyone explain that to me?
Here is a bit of interesting research. This is a report on how many days each member of society has to work in order to pay his/her share of the public debt brought to you courtesy of your government:
http://www.fiscalaccountability.org/userfiles/COGD2009_web%281%29.pdf
It makes for some surprising reading.

Tags: bankruptcy, boondoggle, credit, deflation, deleveraging, poverty, war, white collar crime
This entry was posted on October 8, 2009 at 4:59 am and is filed under Current events: economics & politics. You can follow any responses to this entry through the RSS 2.0 feed.
You can leave a response, or trackback from your own site.


December 31, 2010 at 9:16 am |
[…] https://guidoromero.wordpress.com/2009/10/08/im-not-an-economist-but/ […]